Monitor Kubernetes Services & Pods with Prometheus and Send Alerts to Slack
Last edited 206 days ago
🧩 Short Summary
Proactively alert to service endpoint changes and pod/container issues (Pending, Not Ready, Restart spikes) using Prometheus metrics, formatted and sent to Slack.
🗂️ Category
DevOps / Monitoring & Observability
🏷️ Tags
kubernetes, prometheus, slack, alerting, sre, ops, kube-state-metrics
✅ Prerequisites
- Prometheus scraping kube-state-metrics v2.x.
- Slack App or Incoming Webhook (channel access).
- n8n instance with outbound access to Prometheus & Slack.
🔑 Required Credentials in n8n
Slack: Bot OAuth (chat:write) or Incoming Webhook URL.
(Optional) Prometheus Basic Auth (if your Prometheus needs it).
🧠 What This Template Does
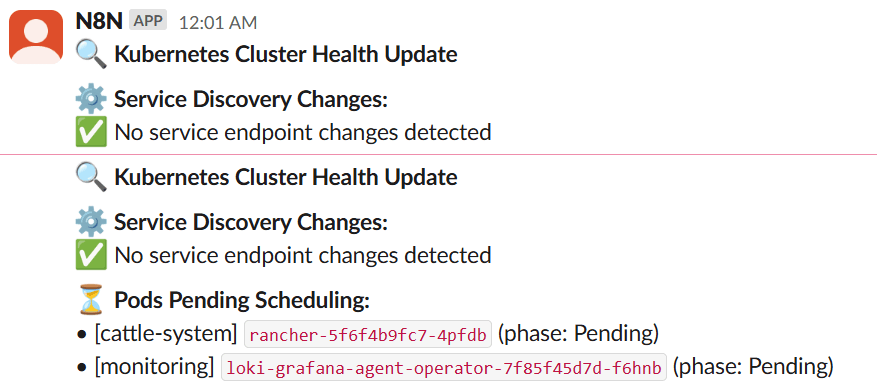
- Detects pods stuck in Pending (scheduling problems like taints/affinity/capacity).
- Detects containers Not Ready (readiness probe failures).
- Detects container restart spikes over a sliding window (default 5 minutes).
- Detects service discovery changes (endpoint count diffs current vs previous snapshot).
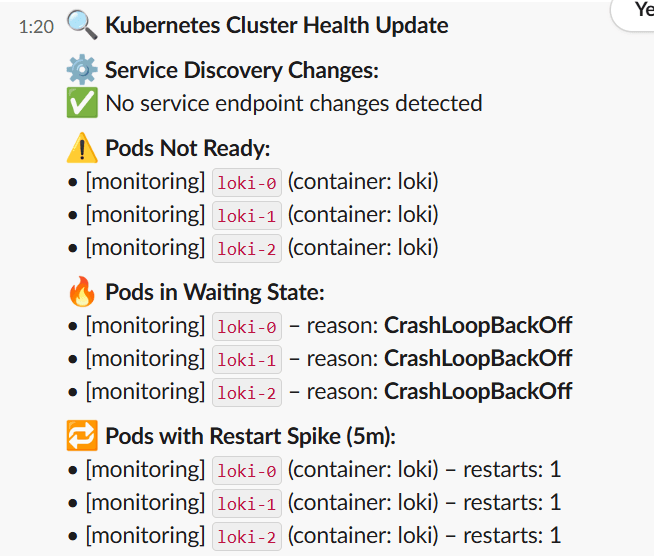
- Sends clean, emoji-enhanced Slack alerts with pod/namespace/service context.
- Outputs a 5-minute summary block to reduce noise.
📣 Slack Message Style (examples)
You may also like
New to n8n?
Need help building new n8n workflows? Process automation for you or your company will save you time and money, and it's completely free!


